What is the Santa Claus Rally: History, Predictions and Best Stocks to Buy in 2025
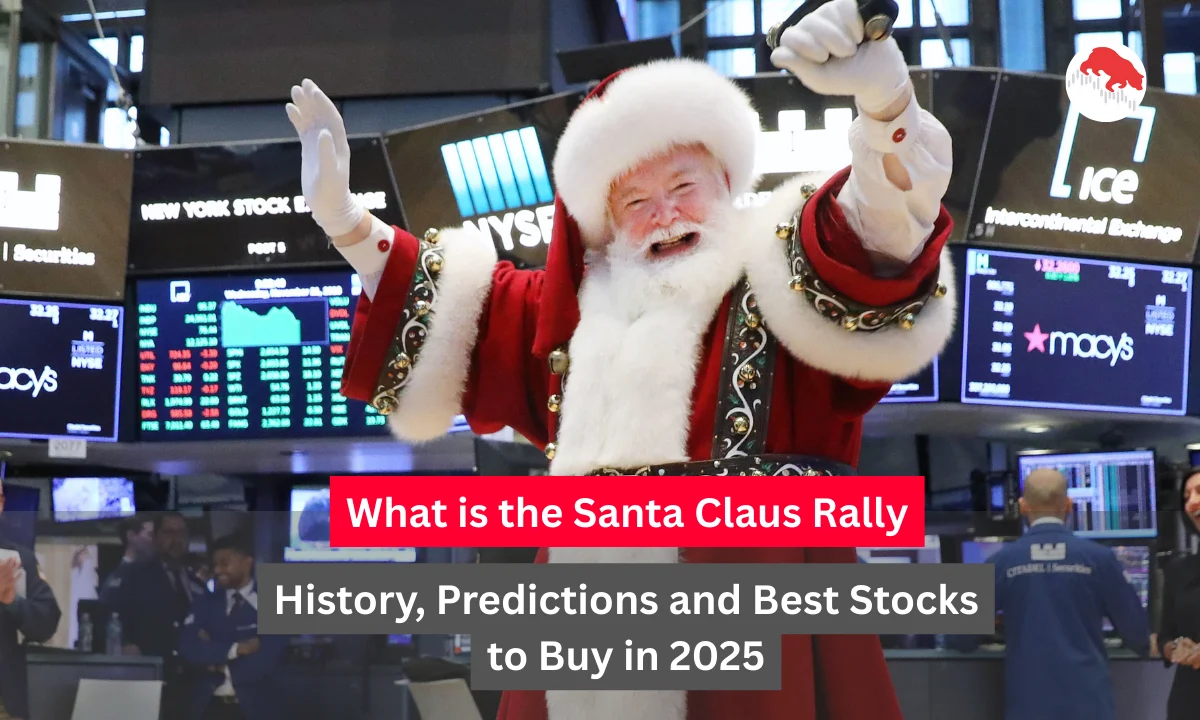
What is the Santa Claus rally and why does it matter for your investment portfolio. The Santa Claus rally is a seasonal stock market pattern that has caught my attention over the years as I have tracked year-end market movements.
This phenomenon occurs during the last five trading days of December and the first two trading days of January creating a seven-day window of potential gains.
I have noticed that during this period stock prices tend to rise consistently and this has been happening since 1972 when Yale Hirsch first documented it in his Stock Trader’s Almanac. The rally brings holiday cheer to investors with historical data showing impressive returns.
Understanding this pattern has helped me make better investment decisions during the year-end season.
Key Takeaways
- The Santa Claus rally spans seven trading days from late December to early January
- Historical success rate stands at 76-79% for positive returns since 1950
- Average returns during this period reach 1.3% compared to 0.2-0.4% for typical seven-day periods
- Small-cap and mid-cap stocks have consistently outperformed large-caps during this rally
- Multiple factors drive the rally including holiday optimism, tax-loss selling completion and year-end bonuses
- 2025 predictions suggest modest gains despite market volatility and high valuations
Understanding What is the Santa Claus Rally
I have studied this market pattern extensively and found it fascinating how consistently it appears. The Santa Claus rally happens when stock markets gain momentum in the final trading week of the year.
This is not just folklore or market superstition. Real data backs this trend and I have seen it play out multiple times in my investment journey.
The rally typically begins on the last trading day before Christmas and extends through the second trading session of the new year. Holiday spirit alone does not drive these gains. Several practical factors come into play including lighter trading volumes because many institutional traders take vacations. This reduced selling pressure allows prices to drift higher naturally.
How Long Does the Santa Claus Rally Usually Last
The duration is quite specific and I always mark these dates on my calendar. The rally covers exactly seven trading days. It starts with the last five trading days of December excluding Christmas Day if it falls on a weekday.
Then it continues through the first two trading days of January excluding New Year’s Day. In 2025 this period runs approximately from December 24 through January 5 depending on how weekends and holidays fall.
The timing rarely changes which makes it easier for me to plan my investment strategy. I have noticed that even when the rally starts weak it can still finish strong within this window. The consistent timeframe has made this one of the most reliable seasonal patterns I track.
Santa Claus Rally History and Performance Data
The numbers tell an impressive story that I have verified through multiple sources. Since 1950 the S&P 500 has delivered an average return of 1.3% during this seven-day period. What makes this really interesting is the success rate.
Positive returns occur 76-79% of the time which is significantly higher than the normal seven-day period that shows positive returns only 57-58% of the time. I have compared these statistics with regular market periods and the difference is striking.
The rally has worked in various market conditions including bull and bear markets. Some years brought exceptional gains like the 7.4% surge during the 2008-2009 recovery period. Failures are rare but when they happen they can signal trouble ahead as seen before the bear markets of 2000 and 2008.
In India the pattern also holds strong based on my analysis. Since 2001 the Nifty 50 has posted positive December returns in 17 out of 24 years. The BSE Sensex showed gains in 16 of those 24 years. What caught my attention is how small-cap and mid-cap indices perform even better.
The Nifty SmallCap index rose in 17 of the last 20 years while the Nifty MidCap index advanced in 18 of 24 years. In the past decade Indian small-caps have achieved a perfect 100% win rate during the Santa rally window with average returns of 3.55%.
Mid-caps delivered 2.63% average returns while large-caps gave 1.78% returns during the same period.
Santa Claus Rally 2025 Predictions and Market Outlook
Looking at the current market situation I see both opportunities and risks. The S&P 500 is up approximately 15-16% year-to-date as of late December 2025 trading near all-time highs around 6,800-6,900.
This marks the third consecutive year of 10%+ gains which is impressive. Several positive factors support a potential rally this year. Inflation has been cooling which I consider a major tailwind. The Federal Reserve may cut interest rates in 2026 providing additional support.
Recent strong inflows of around $100 billion into stocks show continued investor confidence. Holiday sentiment typically boosts buying activity during this period.
However I also see significant risks that investors should not ignore. Valuations are quite high especially in AI and technology stocks. The Fed has sent less dovish signals than many expected. December has shown some weakness with the market down about 0.7% in certain stretches.
Despite these headwinds many analysts I follow predict modest gains of 1-2% during the Santa rally period. Some even suggest the S&P could reach 7,100 if momentum builds. A failure of the rally would be concerning and could signal caution for 2026.
History shows that 77% of the time the rally succeeds even after weak December starts which gives me confidence.
For Indian markets the outlook appears cautiously optimistic. The Nifty recently touched record highs near 26,300 before facing pressure from a weakening rupee and foreign fund outflows.
Strong domestic institutional buying and monthly SIP inflows exceeding Rs 20,000 crore provide a solid liquidity cushion. Small-cap and mid-cap stocks could steal the spotlight this year-end based on their historical outperformance and recent value corrections.
Santa Claus Rally Stocks to Buy and Investment Strategy
I always remind myself that past performance does not guarantee future results but patterns can guide strategy. Based on historical trends certain sectors and stock categories tend to benefit more during the Santa rally period.
Small-cap and mid-cap stocks have consistently outperformed large-caps during this window. These stocks often rebound as tax-loss selling ends and investors hunt for value. I have seen beaten-down quality names stage impressive comebacks during this period.
For US markets several sectors look attractive to me right now. Technology and AI infrastructure remain strong despite valuation concerns. Companies like Micron have shown robust demand for AI chips which strengthens the sector’s outlook.
The Magnificent Seven tech giants including Tesla, Amazon, Alphabet, Meta, Nvidia, Apple and Microsoft continue to dominate. Materials and mining stocks benefit from strong metal prices and industrial demand. Airlines and travel companies see seasonal strength as holiday travel peaks. Aerospace and defense stocks gain from increased military spending and geopolitical tensions.
Rather than picking individual stocks I prefer diversified exposure through ETFs during this volatile period. The MAGS ETF provides access to the Magnificent Seven tech stocks.
XME covers metals and mining companies. JETS focuses on airlines and travel while ITA targets aerospace and defense. These ETFs spread risk while capturing sector momentum.
For Indian markets I focus on quality names with earnings visibility. Small-cap and mid-cap stocks with reasonable valuations and strong fundamentals look attractive. Banking and IT sectors could drive the next rally leg based on current technical patterns.
The key is avoiding laggards and focusing on stocks leading price action within their sectors. I always consider my risk tolerance before making any investment decision. Diversification remains crucial especially given current market volatility and high valuations in certain segments.
Tags: Santa Claus Rally, Stock Market Trends, Year-End Rally, Investment Strategy, Small-Cap Stocks, Market Seasonality, S&P 500
Related Posts :


Share This Post